
Descriptive Statistics in Excel is about summarizing and understanding the data. It helps us in finding quick insights into our datasets. For example, we may look at the average, mean, mode etc to understand the patterns. Excel offers ready to use formulas for these so that we don’t have to perform lengthy calculations manually.
Descriptive Statistics is important for students, business analysts and project managers. It often forms the first step before diving deep into datasets. In this guide, we will explore the techniques and best practices related to Descriptive Statistics.
———————————————————————————————————————————————————-
1. What is Descriptive Statistics in Excel?
As discussed above, Descriptive statistics is used for summarizing a numerical dataset. We can quickly find out the main features, patterns of the dataset. Doing it manually is not possible as we can not understand the patterns if we simply observe hundreds / thousands of rows.
Here are some of the common descriptive statistics metrics:
- Mean – is the average value of a dataset.
- Median – represents the middle value of a dataset when data is sorted in ascending or descending order.
- Mode – gives us the most frequently appearing value.
- Standard Deviation – Tells the spread of the data.
- Variance – provides the square of the standard deviation.
- Minimum & Maximum – are simply the smallest and largest values.
- Range – is the difference between maximum and minimum numbers in the dataset.
- Count – tells the total number of data points.
- Sum – is simply the sum total of all values.
With these values, we can develop a first hand understanding of important metrics like central tendency, spread, and distribution of your dataset.
———————————————————————————————————————————————————-
2. Why Use Excel for Descriptive Statistics?
We should use excel for descriptive statistics because of following reasons –
- It is very easy to use with no coding required.
- Excel has many built-in, ready to use formulas like AVERAGE, MEDIAN, STDEV.P.
- It has Data Analysis ToolPak which is capable of generating full descriptive summaries instantly.
- We can also visualize results using charts and dashboards.
- Works perfectly well for both small and medium datasets.
———————————————————————————————————————————————————-
3. Getting Started: Activating Data Analysis ToolPak
We have a powerful built-in feature in Excel, specifically for descriptive statistics. It is not enabled straightaway by default so we have to do it manually. Following are the steps –
1. First go to File, then Options.
2. Then select Add-ins.
3. You will thus see Excel Add-Ins at the bottom, choose and click Go.
4. Finally, locate Analysis ToolPak and click OK.
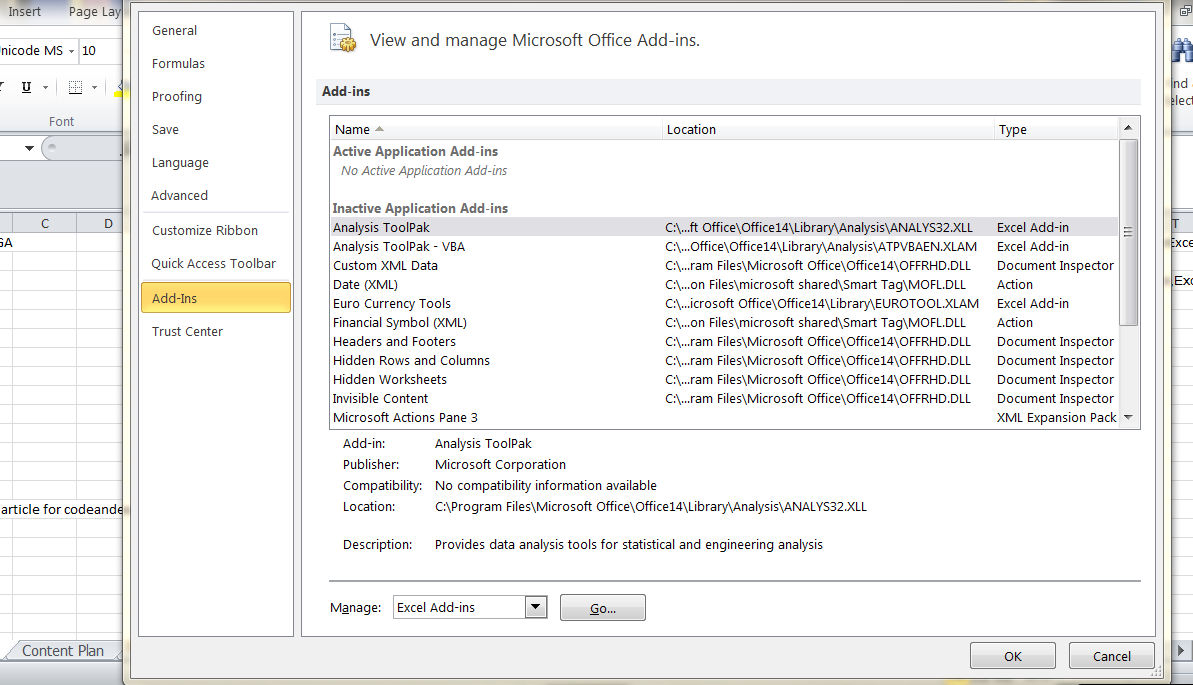
Thus, you will see Data Analysis under the Data tab.
———————————————————————————————————————————————————-
4. Using Formulas for Descriptive Statistics in Excel
Let’s look at this dataset of monthly sales (in ₹) before writing the formulas:
| Month | Sales |
| Jan | 4500 |
| Feb | 5200 |
| Mar | 4800 |
| Apr | 5300 |
| May | 5000 |
| Jun | 4700 |
Then we will use the in-built formulas for basic metrics –
a) Mean (Average)
=AVERAGE(B2:B7)
Result: 4916.67
b) Median
=MEDIAN(B2:B7)
Result: 4900
c) Mode
=MODE.SNGL(B2:B7)
You may get an error if there are no repetitive numbers. For example, in this dataset we don’t see any such numbers.
d) Minimum and Maximum
=MIN(B2:B7) = 4500
=MAX(B2:B7) = 5300
e) Range
We can calculate this basically by deducting min value from the max value like this =MAX(B2:B7)-MIN(B2:B7)
Result: 800
f) Standard Deviation
- Population Standard Deviation measures how spread out the data is within an entire population. It explicitly quantifies the distance between individual data points and the population mean.
=STDEV.P(B2:B7)
- Similarly, Sample Standard Deviation is basically a measure of dispersion or spread of data points within a sample, which indicates how much individual values deviate from the sample’s mean.
=STDEV.S(B2:B7)
g) Variance
- Population Variance =VAR.P(B2:B7)
- Sample Variance =VAR.S(B2:B7)
———————————————————————————————————————————————————-
5. Using Data Analysis ToolPak for Quick Summary
With ToolPak, we can instantly get further key statistic without having to calculate manually. We basically need to follow the below procedure –
1. Firstly, go to Data → Data Analysis → Descriptive Statistics
2. Then select the input range where data is stored (For e.g., B2:B7)
3. Then just tick Summary statistics
4. Finally, choose the cells for inserting the output and click OK.
This will basically give us:
- Mean
- Standard Error
- Median
- Mode
- Standard Deviation
- Sample Variance
- Kurtosis & Skewness
- Range, Minimum, Maximum
- Sum, Count
———————————————————————————————————————————————————-
6. Understanding the Output
For the data discussed above, below is evidently the output we will get from ToolPak:
- Mean – 4916.67
- Median – 4900
- Mode – N/A
- Standard Deviation – 293.94
- Variance – 86400
- Range – 800
- Minimum – 4500
- Maximum – 5300
- Count – 6
———————————————————————————————————————————————————-
7. Visualizing Descriptive Statistics in Excel
We can go one step further by adding visualization to numbers with the help of charts and tables.
For example:
- Column Chart – Compare monthly values accordingly.
- Box & Whisker Plot – Besides column chart, we can also show spread and outliers.
- Histogram – Thirdly, we can plot distribution via Histogram.
———————————————————————————————————————————————————-
8. Practical Applications of Descriptive Statistics in Excel
Below are some real life use cases where analysts presently use descriptive statistics in Excel:
- Sales Reports – Summarizing performance over time is a straightaway use case.
- Quality Control – Secondly, tracking variation in production.
- Survey Analysis – Understanding respondent patterns.
- Finance – Similarly in Finance, analyzing returns, expenses, or revenue spread.
———————————————————————————————————————————————————-
9. Practice Questions on Descriptive Statistics in Excel
Have a look at the below dataset likewise to the data discussed above-
Score – 65, 72, 81, 69, 74, 78, 85, 70
Now try to find out the below by formulas and via ToolPak:
1. Firstly, find out the mean, median, and mode.
2. Afterwards, calculate the range of scores.
3. Another question is to find out the sample standard deviation.
4. Also use Data Analysis ToolPak to generate a full descriptive statistics summary.
5. Finally, create a box plot for the scores.
———————————————————————————————————————————————————-
10. Key Takeaways
- With descriptive statistics in Excel, we can also simplify large datasets into understandable numbers.
- Excel offers us formulas and also the Data Analysis ToolPak for easy calculation.
- It is important to check whether our data is a sample or a population so that we can select the right formulas.
- We can also deploy story telling features of Excel like charts to provide better insights.
Additionally, check out our other articles on –
Excel for Finance: EMI, SIP and Loan Calculator
Date and Time Functions in Excel: A Complete Guide
How to Create Dependent Drop Down List in Excel
Microsoft’s QnA page on Descriptive Statistics in Excel