Structured Tables in Excel help in organizing, analyzing, and managing data efficiently. You must have come across instances when you have data in a table from A2:D1000 and you have applied formulas and formatting accordingly, for e.g., =sum(C2:C1000). However, you have to add data frequently to your table in rows below 1000 so you must update the range in every formula and also expand the formatting to newly added rows /columns.
Structured tables in Excel can take care of this and improve the efficiency and readability of your data. That is why in this guide, we will discuss what structured tables are, how to prepare those and also how to apply formulas, filters, slicers, and more on those.
🧾 What Is a Structured Table in Excel?
As the name suggests, a structured table in Excel automatically applies formatting, intelligent referencing, dynamic range expansion, and sorting/filtering capabilities to your data.
This is what happens when you apply structured table formatting to a range of data –
- Excel assigns a name to the table
-
Adds filter buttons to the table
-
Updates formatting which you may adjust as per your liking
-
Gives column names in formulas instead of cell references
✨ Benefits of Structured Tables in Excel
- Auto-expanding ranges – New rows and columns get automatically included in formulas
- Easier formulas – How about
=SUM(Table1[Sales])instead of=SUM(B2:B1000)? - Better visuals – It also applies default styling which you may change
- Built-in filters – Quickly sort and filter data
- Ideal for Pivot Tables – With tables, it is easier to dynamically feed data into Pivot Tables
- Time-saving – Less manual updating, fewer errors
🛠️ How to Create a Structured Table in Excel
Method 1: Shortcut Method
-
First go to any cell inside the data range.
-
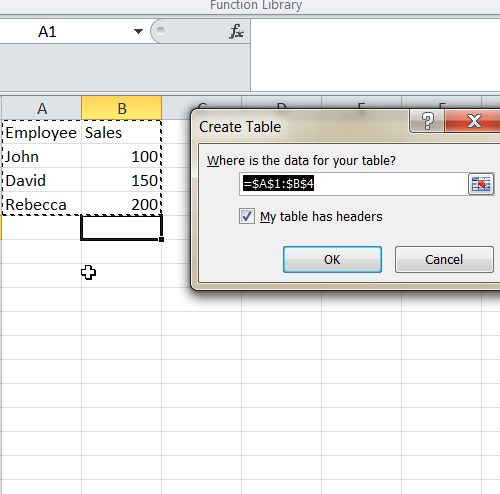
Then, press
Ctrl + T. A box will open up like this –
-
Tick the checkbox – “My table has headers”.
-
Click OK.
That’s it. Excel will convert your raw data into an intelligent table that auto updates whenever you add more rows / columns to it.
Method 2: Ribbon Method
-
Select your data range.
-
Then go to Insert > Table.
-
Cross check headers and click OK.
Excel will apply the formatting and give the table a default name like Table1.
✏️ How to Rename Your Table
-
Click anywhere inside the table.
-
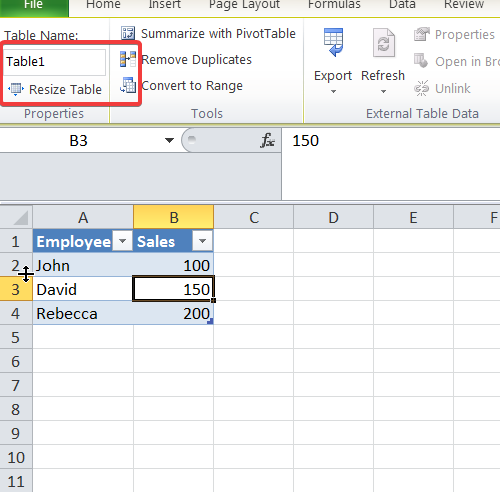
Now go to Design tab. At the top left, you will find the highlighted box –
-
Replace
Table1with the preferred name likeSalesData.
It is recommended to assign meaningful names to write better formulas.
🧠 Structured Table Syntax
With structured tables, we can make our formulas more human-readable by referencing table name and column instead of cell ranges.
Example:
This is how we can do the sum of values from a column named Sales in a table called SalesData-
🧮 Examples of Using Structured Table Formulas
1. Basic SUM
2. AVERAGEIF Example
3. VLOOKUP Using Structured Table
🧽 How to Format and Style a Table
-
We can of course alter the table designs as per our liking. Just go to Table Design tab.
-
Pick a style from Table Styles.
-
Select or unselect options like Header Row, Total Row, First Column, etc.
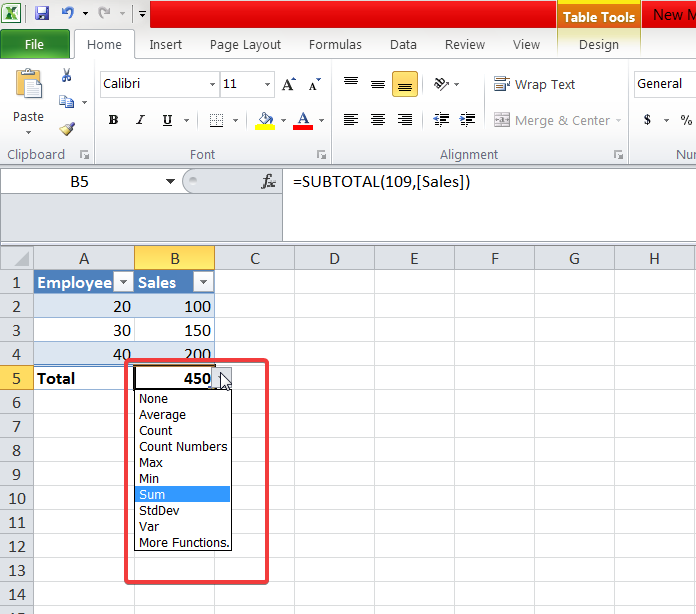
If we check Total Row under designs, we get a dropdown at the table bottom with options like Sum, Average, Count, Max, Min, etc.
📊 Using Tables with Pivot Tables
- Start by clicking anywhere in the structured table.
- Then go to Insert > Pivot Table.
- Lastly, select the location to place the pivot table and select the design.
Best part here is that if you add data to the original table later on, just hit refresh on the pivot table and it will auto-update the data range.
🧪 Practice Questions
Try these questions on your own now. If you need help, drop your query in the comment and we will answer.
- Create a table having data about employee name, department and salary.
-
Now make a structured table from this dataset and give this table a name.
- Straightaway insert a new column and calculate a bonus of 10% of salary for all employees. Use a calculated column formula.
-
Check if auto-filters are applied or not when you created the table.
-
Additionally, create a pivot table from the structured table.
📦 Bonus Tip: Convert Structured Table in Excel Back to Range
If you require to go back to cell ranges:
-
Right-click anywhere inside the table.
-
Select Table > Convert to Range.
Formatting will stay, but the dynamic functionality will be lost.
🧵 Summary of Structured Tables in Excel
One of Excel’s most potent and underutilized features, structured tables can significantly increase your productivity. They contribute to fewer errors, easier updates, and simpler formulas. Try them out, regardless of whether you’re managing hundreds of rows or just basic reports.
Learning tables is a must if you’re serious about becoming an Excel whiz. Now go ahead and create a table with your data and let Excel handle the rest!
Also check out our other articles on –

1 thought on “Working with Structured Tables in Excel: A Complete Guide”